
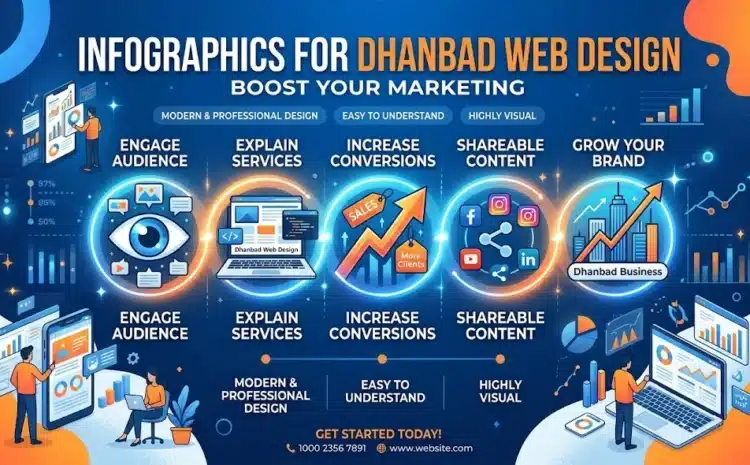
Infographics for Dhanbad Web Design: Boost Your Marketing
In the bustling market of Dhanbad, standing out as a web design agency requires more than just great portfolios; it demands a compelling content strategy. Are you looking to capture attention and communicate complex ideas effortlessly to potential clients? Then incorporating infographics for Dhanbad web design into your marketing efforts is not just an option, it’s a strategic imperative. This guide will show you exactly how visual content can transform your outreach, boost your local SEO, and drive client acquisition in Dhanbad.
Why Infographics are Essential for Dhanbad Web Design Marketing
In a world saturated with information, your web design agency needs to deliver messages that cut through the noise. Infographics do precisely that, simplifying intricate concepts into digestible, visually appealing formats. This makes them a cornerstone of effective visual content marketing.
What most people miss is how profoundly visuals impact memory and understanding. People remember 65% of visual information compared to just 10% of text-based information, according to Visme data. This means a potential client in Dhanbad is far more likely to recall your service offerings presented in an infographic than in a dense block of text.
Infographics are not just pretty pictures; they are powerful communication tools that elevate your web design agency marketing. They demonstrate your expertise without overwhelming your audience, showing them what you know rather than just telling them. As Robert Rose, Chief Content Advisor at the Content Marketing Institute, aptly puts it, “Marketing is telling the world you’re a rock star. Content marketing is showing the world you are one.” Infographics are your stage.
Beyond memorability, infographics significantly boost engagement rates. They are 30 times more likely to be read than a written article, making them a highly efficient way to convey value. For web designers in Dhanbad, this translates to more eyes on your services, better understanding of your processes, and ultimately, stronger connections with local businesses seeking digital solutions.
How Infographics Boost Local SEO for Web Design Agencies in Dhanbad
For any web design business in Dhanbad, attracting local clients is paramount, and this is where infographics offer a unique advantage for local SEO strategies. Google prioritizes content that is engaging and authoritative, and well-optimized infographics tick both boxes. When you create informative visuals, you naturally encourage longer dwell times on your website, signaling to search engines that your content is valuable.
One key benefit is their power to generate backlinks. High-quality, data-rich infographics are highly shareable, increasing the likelihood that other local businesses or industry blogs will link back to your site. These backlinks are crucial for improving your domain authority and boosting your search engine rankings for terms like “web design SEO Jharkhand” or “Dhanbad web design marketing strategies.”
Infographics also provide excellent opportunities for image SEO. By using descriptive alt text, relevant file names, and integrating your focus keyword, “infographics for Dhanbad web design,” into the image metadata, you make your visuals discoverable through image searches. This opens up another pathway for local businesses to find your services, enhancing your overall digital marketing Dhanbad efforts.
In practice, an infographic detailing “The Top 5 Website Features Dhanbad Businesses Need in 2024” can attract local searches, drive traffic, and establish your agency as a local authority. For more insights on attracting local clients, consider reading our guide on Attract Local Clients: Web Design Strategies for Dhanbad.
Tailored Infographic Ideas for Dhanbad Web Designers (with examples)
The real magic happens when you tailor your visual content to your specific audience in Dhanbad. Generic infographics won’t cut it; you need ideas that resonate with local business challenges and aspirations. Here are some concrete infographic ideas directly applicable to your web design agency:
Infographic Ideas for Local Impact
-
“The Anatomy of a High-Converting Dhanbad Web Design Homepage”: Visualize the essential elements of a successful local business website, from clear calls-to-action to compelling local testimonials. Break down components like hero sections, service blocks, and contact forms, showing *why* each is important for local lead generation. This helps businesses understand the value of professional web design.
-
“The Journey of a Website Project: From Concept to Launch (Dhanbad Edition)”: Map out your web design process step-by-step, from initial consultation to post-launch support. This transparency builds trust and clarifies expectations for potential clients, demystifying the process of working with a web design agency marketing team.
-
“Before & After: Dhanbad Business Website Redesigns”: Showcase the transformation of a local client’s website. Use visuals to highlight key improvements in design, speed, mobile responsiveness, and even conversion rates. This type of infographic provides tangible proof of your expertise and the value you deliver, directly addressing client acquisition strategies.
Data-Driven Infographics for Dhanbad Market
-
“Local Digital Marketing Trends in Dhanbad (2024-2026)”: Use visually engaging charts and graphs to present data on local search behavior, mobile usage, or e-commerce adoption in Dhanbad. This positions your agency as a thought leader in digital marketing Dhanbad, offering valuable insights to local businesses.
-
“Website Performance Benchmarks for Dhanbad Businesses”: Create an infographic comparing average website loading speeds, mobile-friendliness scores, or SEO readiness for businesses in the region. This can highlight common pain points and illustrate where your services can help local companies improve.
For more inspiration on creating compelling visuals that engage your local audience, explore our article on Dhanbad Web Graphics for Engagement: Icons & Infographics.
Crafting Engaging Infographics: Best Practices for Web Design Content
Creating an infographic is more than just combining images and text; it’s about telling a compelling visual story that resonates with your audience. For web designers in Dhanbad, this means adhering to design principles that enhance clarity and impact.
First, focus on a single, clear message. Each infographic should address one core idea or answer one critical question. This prevents information overload and ensures your audience grasps the main takeaway. Ann Handley, Chief Content Officer at MarketingProfs, advises, “Make your customer the hero of your stories.” Your infographics should solve a problem for your prospective client, making them feel understood.
Next, prioritize data visualization marketing. Use charts, graphs, and icons effectively to represent data in an easily understandable way. Avoid clutter; white space is your friend. Choose a consistent color palette and typography that aligns with your brand identity and ensures readability. Tools like Visme or Venngage can be invaluable for creating professional-looking visuals without needing advanced graphic design skills. In fact, nearly half of marketers spend 20-50% of their budgets on visual content creation, often leveraging these infographic marketing tools.
Finally, ensure your infographic flows logically. Guide the viewer’s eye through the information with a clear visual hierarchy. Use headings, subheadings, and numbered lists to break down complex topics. Doug Kessler, Co-founder of Velocity, notes, “Traditional marketing talks at people. Content marketing talks with them.” Infographics foster this conversation by making complex information accessible, cultivating genuine engagement.
Measuring the Impact of Infographics on Your Dhanbad Web Design Business
Creating beautiful infographics is only half the battle; understanding their performance is crucial for optimizing your Dhanbad web design marketing strategies. Without measurement, you can’t truly gauge the return on your investment in visual content for web development.
Start by tracking key metrics. Look at website traffic: Are your infographic-containing pages seeing an increase in visitors? Websites using infographics can see up to a 12% increase in traffic. Also, monitor engagement rates visual content receives, such as time spent on page, scroll depth, and social shares. Infographics can increase social media engagement by up to 650%, a significant boost for local visibility.
Another vital metric is inbound links. As mentioned, well-designed infographics are highly shareable and can generate valuable backlinks, which directly impact your SEO. Incorporating infographics can lead to a 178% increase in inbound external links. Use tools like Google Analytics and Google Search Console to monitor these factors.
Ultimately, the goal is lead generation web design. Track how many leads or inquiries originate from pages featuring your infographics. Are people downloading your infographic as a lead magnet? Are they clicking through to your contact page after viewing it? By tying these metrics back to your business objectives, you can demonstrate the tangible value of infographics for your Dhanbad web design business.
Beyond Creation: Distributing Your Dhanbad Web Design Infographics Effectively
A stunning infographic is only effective if people see it. Strategic distribution is key to maximizing the reach and impact of your infographics for Dhanbad web design. Think of your infographic as a powerful asset that needs to be deployed across multiple channels.
Your own website and blog are the primary homes for your infographics. Embed them within relevant blog posts that delve deeper into the visual’s topic. This not only provides valuable context but also improves the overall user experience on your site. For instance, an infographic on “Content Strategy for Web Design Dhanbad: Local Leads Guide” should be accompanied by a comprehensive article.
Leverage social media platforms where your target audience, local Dhanbad businesses, are active. Share snippets or entire infographics on Facebook, LinkedIn, and Instagram. Remember to optimize your posts with relevant hashtags and compelling captions to encourage shares and discussions. Email marketing is another powerful channel; include infographics in your newsletters or dedicated email campaigns to your subscriber list.
Consider outreach to local business directories, industry blogs, or news outlets in Dhanbad or Jharkhand. Offer your infographic as a valuable resource they can share with their audience, often resulting in valuable backlinks and increased visibility. Orbit Media Studios offers excellent advice on optimizing infographics for SEO, emphasizing the importance of diverse distribution.
Future-Proofing Your Content: Visual Trends for Dhanbad Web Designers
The digital landscape is constantly evolving, and so too are visual content trends. To keep your content strategy for agencies ahead of the curve, especially in a dynamic market like Dhanbad, it’s essential to look at what’s next for visual content for web development.
Interactive infographics are gaining significant traction. Instead of static images, these allow users to click, scroll, or hover for more information, creating a more engaging and memorable experience. Imagine an interactive infographic showcasing the “Evolution of Web Design,” where users can click on different eras to see design trends and technologies. This gamified approach improves user retention and provides a richer understanding of complex topics.
Another major trend is the emphasis on mobile-first design for all visual content. With a significant portion of internet users accessing content on smartphones, your infographics must be responsive and legible on smaller screens. This means simplifying layouts, using larger fonts, and ensuring images load quickly. This is particularly relevant for Dhanbad businesses targeting local mobile users.
Personalization and dynamic content are also on the rise. While more complex to implement, imagine an infographic that slightly adjusts its data points or examples based on the user’s industry or location within Dhanbad. This level of tailored content creates a highly relevant experience. According to Martech Zone, 40% of marketers believe 20-50% of businesses will rely heavily on visual content by the end of 2024, highlighting the shift towards more sophisticated visual strategies. Embracing these trends ensures your agency remains competitive and continues to attract high-quality leads in Dhanbad.
Frequently Asked Questions
How do infographics help content marketing?
Infographics enhance content marketing by making complex information easy to understand and remember. They boost engagement, increase social shares, and can drive significant website traffic, effectively communicating your message to a wider audience.
How effective are infographics in marketing?
Infographics are highly effective in marketing, with studies showing they are 30 times more likely to be read than plain text and can increase inbound links by 178%. They significantly improve information retention and social media engagement, making them a powerful tool for brand visibility and lead generation.
What is the purpose of infographics in content marketing?
The primary purpose of infographics in content marketing is to simplify complex data, illustrate processes, or tell a story visually. They aim to educate, engage, and persuade your audience efficiently, establishing your brand’s expertise and authority in a visually appealing format.
What are the benefits of using infographics?
The benefits of using infographics include improved audience engagement, better information retention, increased website traffic and backlinks, and enhanced social media shares. They also help establish brand authority and make your content more shareable across various platforms, ultimately supporting your client acquisition strategies.
Harnessing the power of infographics for Dhanbad web design is a smart, forward-thinking move for any agency aiming for local market dominance. From simplifying your service offerings to boosting your local SEO and generating valuable leads, visual content provides a compelling competitive edge. By creating tailored, engaging, and well-distributed infographics, you can effectively communicate your value, build trust, and attract the right clients in Dhanbad. Don’t just tell prospective clients you’re an expert; show them with impactful visuals.
Ready to transform your content strategy? Start designing your first Dhanbad-focused infographic today and watch your engagement soar!

Write a Comment